Money Market Funds' Floating NAVs Stay in Narrow Range for Now
Published: February 14, 2017
Money market funds for decades sold and redeemed their shares in normal times at a stable price, usually $1.00. But in the financial crisis, as the values of their investments came under pressure, one money market fund “broke the buck,” triggering a flight of investors from similar funds.
To reduce the risk of runs, regulators recently required shares of non-government funds for institutional investors to begin trading at a market-based (or floating) net asset value (NAV). The OFR’s ongoing analysis of fund data lets us track how much those share prices vary. So far, NAVs have not shifted much. The real test, however, will come with market stress, when shocks pressure the value of such funds’ assets.
Under the new rule, money market funds must calculate the market value of their shares out to four decimal places. For example, a fund’s share price might be $1.0001, $1.0000, or $0.9999. Funds that sell only to individual investors don’t have to use floating NAVs, but still must report floating NAVs to investors and regulators. Before the Securities and Exchange Commission (SEC) rule went into effect, funds could round up their NAV to a stable value — typically an even $1. Some industry observers worry that variation in floating NAVs might raise investors’ concerns and still create runs. The OFR’s analysis of new fund data finds that, so far, floating NAVs have varied little from $1.
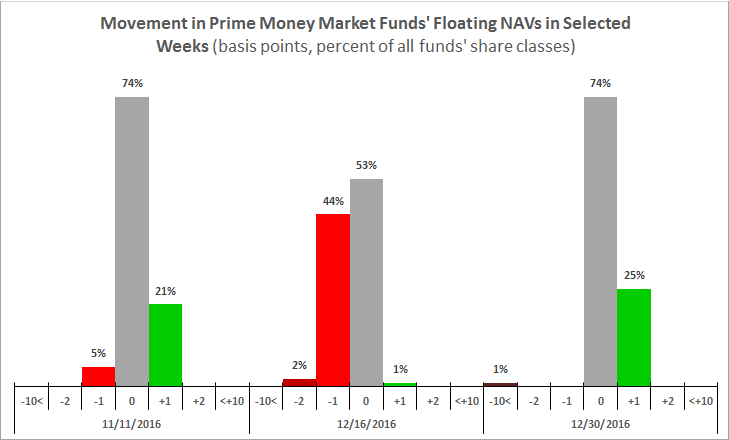
The chart below shows how floating NAVs of share classes in prime institutional money market funds moved during the weeks ending Nov. 11, Dec. 16, and Dec. 31, 2016. Each fund can have multiple classes of shares, which are priced separately.

Note: One basis point equals one hundredth of one percent. NAVs are calculated on the basis of share classes. The data are for the weeks ending on the dates shown.
Sources: SEC Form N-MFP2, OFR analysis
In each week analyzed, most floating NAVs did not change. The values of 21 percent to 25 percent of all share classes moved up by one basis point during the weeks ending Nov. 11 and Dec. 30, 2016, which are representative of most weeks observed so far. (One basis point equals one hundredth of one percent.)
Of the three periods, the largest variation in NAVs was in the week ending Dec. 16, 2016. These movements reflect the Federal Reserve’s increase in its target federal funds rate on Dec. 14, 2016. Usually, when interest rates increase, the values of fixed-income assets decrease. About 46 percent of floating NAV share classes moved lower by one or two basis points. NAVs might decline more if interest rates rise rapidly and unexpectedly.
The size of NAV movements also depends on a fund’s risk profile. Usually, prices of riskier securities — lower quality and longer maturity — vary more. The SEC rule limits the amount of risk money market funds can take. Weighted average maturities of funds, which fell leading up to the rule’s effective date, increased after that date. Given that shift, an unexpected market event such as a change in interest rates might cause greater variation in floating NAVs.
Floating NAVs likely will vary more dramatically when financial markets are under stress. In September 2008, during the financial crisis, the Reserve Primary Fund’s NAV dropped more than 50 basis points, resulting in losses for investors. Within days, investors withdrew hundreds of billions of dollars from this money market fund and similar funds. The panic froze short-term funding to businesses and financial firms. Interest rates spiked.
Since NAVs began floating, money markets have been calm. The extent to which floating NAVs might vary during market cycles will not be known until money market funds again come under stress.
The OFR’s U.S. Money Market Fund Monitor helps regulators and other users track trends and developments in money market funds, encouraging market discipline. The OFR updates the data monthly, uses this tool to conduct enhanced monitoring, and routinely publishes the findings.
Stacey Schreft is the Deputy Director for Research and Analysis at the Office of Financial Research