Five Office Sector Metrics to Watch
Published: June 1, 2023
Views and opinions expressed are those of the authors and do not necessarily represent official positions or policy of the OFR or Treasury.
There is growing apprehension over conditions in U.S. commercial real estate (CRE),1 and for good reason—U.S. financial institutions hold more than $5.6 trillion2 of mortgage debt secured by CRE, and prior CRE downturns have generated financial instability. Like many markets, CRE is multifaceted, and to understand the threat to financial stability this market poses, we must evaluate each of its sectors individually.
Recent concern has focused on the office sector,3 which comprises about one-quarter of the CRE market.4 In this blog, we review the five metrics we are watching to assess the state of the office sector and its implications for the financial system.
1. The Likelihood of a Recession5
The downturn in economic activity in 1990-91, 2001, and 2007-09 reduced CRE demand, resulting in negative absorption of space and higher office vacancy rates (see Figure 1). Lower demand and occupancy reduce CRE’s cash flow and thus shrink its debt service coverage ratio, which is a key covenant for direct loans and CRE loans packaged in commercial mortgage-backed securities (CMBS). If cash flow were to decrease enough, it could trigger breaches of loan covenants and make property owners unable to service their debt, thus creating defaults. CRE prices are also negatively affected by recessions because property values are dependent on properties’ cash flow and the returns required by investors. Recessionary periods also raise risk levels and increase the returns required by CRE investors. The “one-two punch” of lower cash flow and higher required returns has historically put downward pressure on CRE prices (see Figure 2).
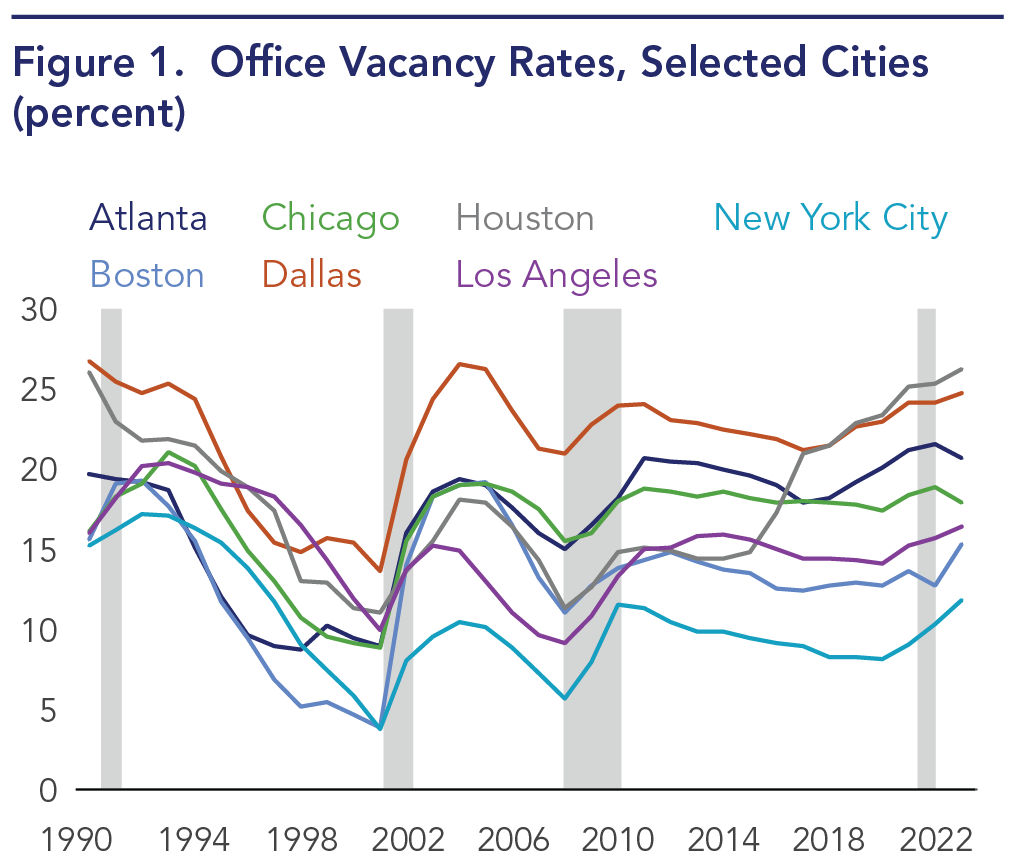
Note: Shaded areas are U.S. recessions.
Sources: Moody’s REIS, Office of Financial Research
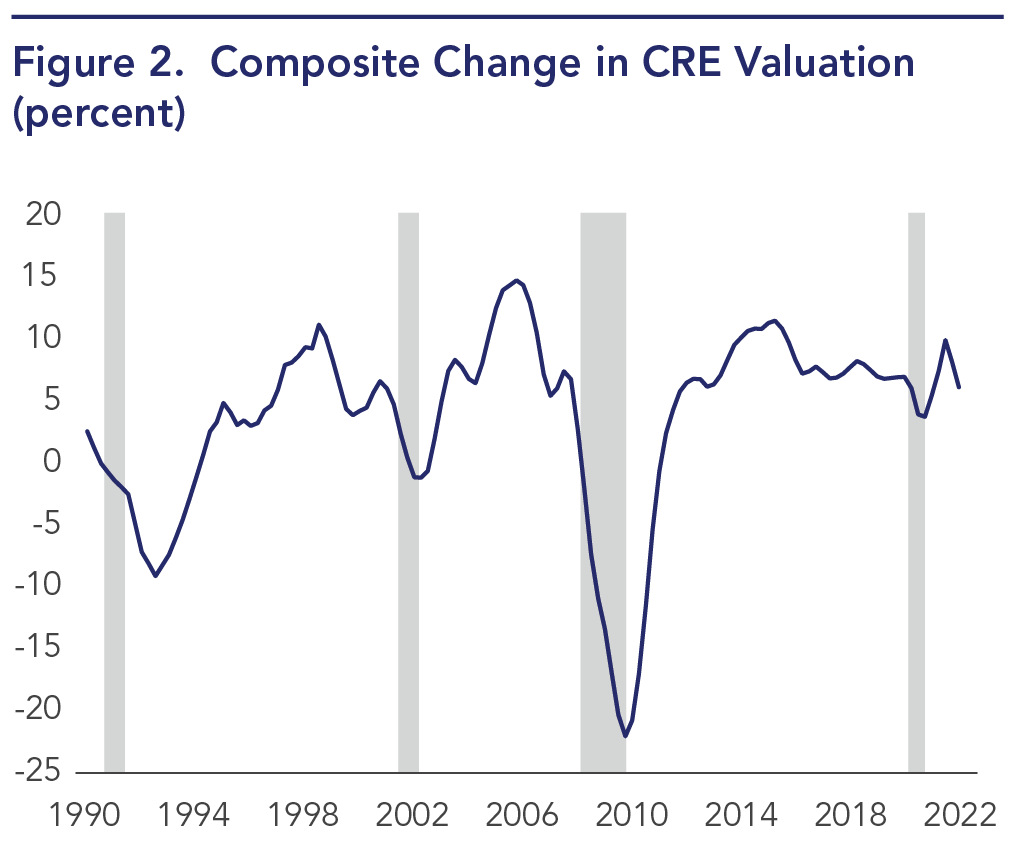
Note: Year-over-year change. Shaded areas are U.S. recessions.
Sources: Real Capital Analytics, Office of Financial Research
2. The Size of the Sublease Market
Since 2020, the reported U.S. office vacancy rate has steadily risen.6 However, the reported vacancy rate does not tell the whole story. Demand for office space is actually weaker than reported, due to the growth in office space available for sublease. Although office space available for sublease remains rent bearing for a building owner, it portends lower future demand for office space because sublease space competes with existing vacant space for tenants, thus limiting its future absorption. The availability of office space for sublease also signals that current tenants may renew their future leases for less space—also reducing future demand.
The amount of subleased office space has grown by nearly 130% since Q2 2020,7 to 210 million rentable square feet. As a point of comparison, during the Great Recession, available sublease space in the United States peaked at 147 million rentable square feet (in Q2 2009).8 Note that the growth of office space available for sublease reflects rational behavior by firms coping with the work-from-home (WFH) trend. Fewer office employees require less office space. Since a tenant cannot break its lease,9 subleasing allows the recovery of at least some of the cost of unused office space.
3. Actual Office Space Occupancy (Measured by Card Key Swipes)
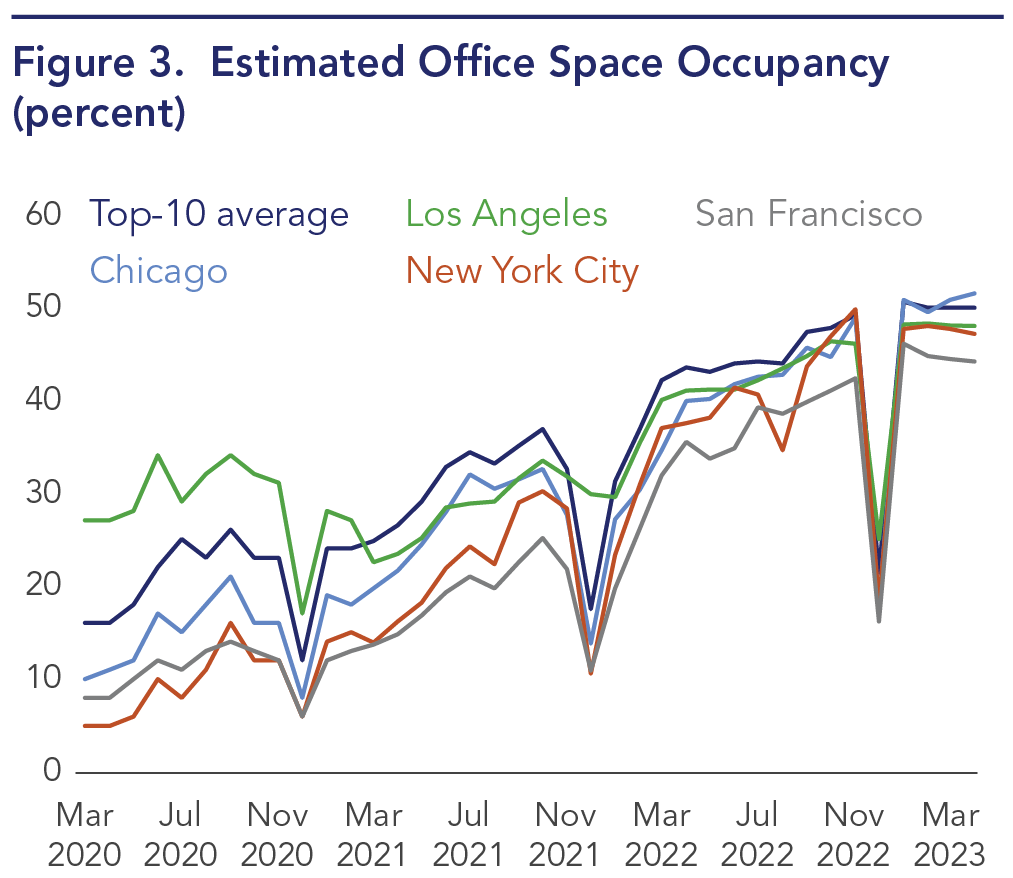
Note: Kastle Back to Work Barometer
Sources: Haver Analytics, Office of Financial Research
The health of the CRE office sector is not only measured by the amount of space leased and rent paid today, but also by how much space will be required in the future. In addition to space available for sublease, we can estimate the amount of space currently occupied by employees by measuring card key swipes using the Kastle Back to Work Barometer.10
Unfortunately, future demand for office space appears weak. In addition to the growth of office space available for sublease, the amount of office space occupied by tenants remains stubbornly low (see Figure 3). Although the current office vacancy rate is 16.4%, the average occupancy rate measured by the Kastle Back to Work Barometer is 49.8%.11 (Note that this represents a weekly average; daily occupancy varies). This implies a structural vacancy rate of 50.2%. Prior to the COVID-19 pandemic, office occupancy averaged close to 100%.12 This means that on average, firms are paying rent for twice as much space as their employees are currently using. If occupancy of existing office space remains low, current office tenants will probably renew their leases for less space—reducing office demand over time.
4. Real Estate Investment Trust (REIT) Performance
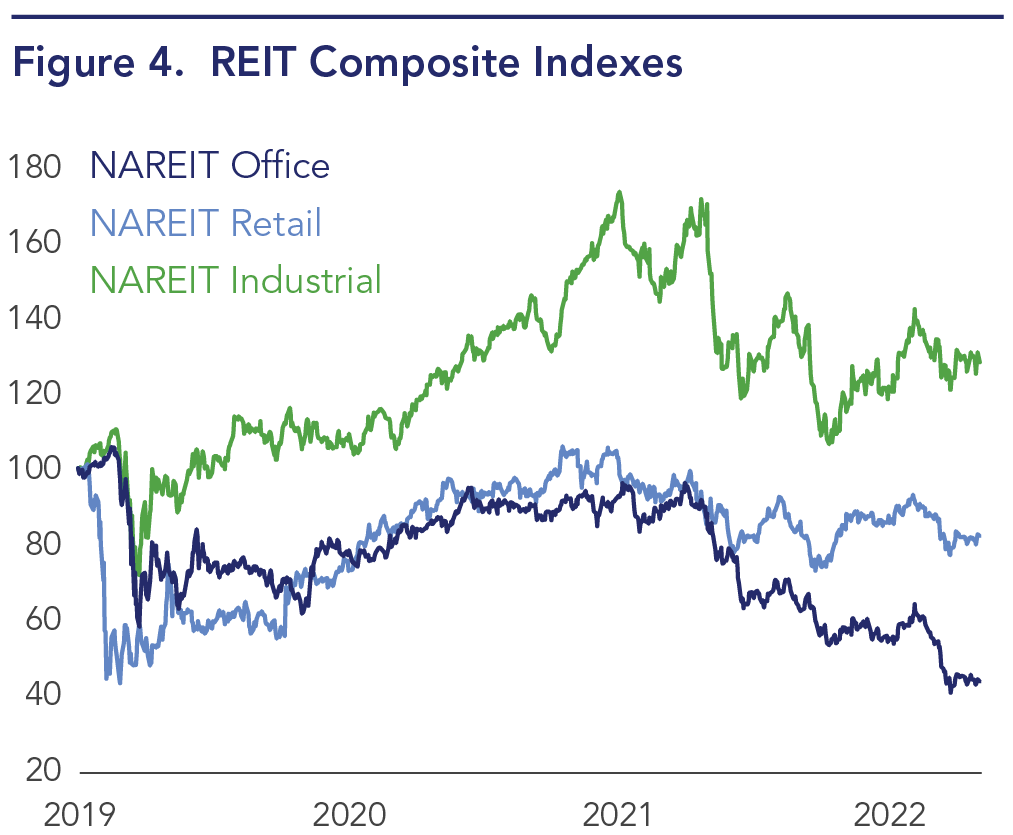
Note: 12/31/2019 = 100
Sources: Bloomberg, Office of Financial Research
The performance of publicly traded REITs provides a real-time indication of investor sentiment on CRE. Of particular interest is the FTSE NAREIT Office REIT index, a composite index that tracks the performance of 21 office REITs with an equity market capitalization of $58.7 billion.
The trend line of this metric suggests negative financial market sentiment—the office REIT sector has underperformed other REIT indexes (see Figure 4). Since year-end 2020, the share price of office REITs has fallen an average of 43%, compared to a 12% increase for retail REITs and an 18% increase for industrial REITs. In fact, the current average share price of office REITs is less than its COVID-19 pandemic low in March 2020. Further deterioration of office REIT prices could augur a more significant office sector downturn.
5. Work-from-Home (WFH) Trends
Working from home appears to be a preferred benefit14 for former full-time office workers, and many firms now recognize WFH’s competitive advantages or are beginning to do so.15 This workplace trend suggests that U.S. firms are no more likely to go back to requiring full-time in-office work than to requiring full-time business attire for office workers. This means that many firms may be leasing more office space than they need—and if the WFH trend becomes permanent, firms will need to downsize their office space as their leases expire. This downsizing could result in a contraction of the office sector as significant as that of regional malls in the 2000s.16
Conclusion
The CRE office sector is substantial, with an estimated value of $3.2 trillion.17 Should firms reduce their office space requirements to reflect the reality of employees’ WFH preference, the CRE office sector could suffer a contraction, posing a risk to financial institutions that hold loans or CMBS secured by office properties. In fact, should offices contract to the same extent that regional malls have, the sector could suffer up to $900 billion of devaluation over time. (The regional mall sector has lost 22% of its total gross leasable area since 2007, and .22 x $3.2 trillion ≈ $900 billion.18 ) This could generate significant financial instability through loan defaults, foreclosures, and equity value depletion. Given the CRE office sector’s size and importance, even a more modest contraction could generate instability in financial institutions with exposure to the sector.
1Goodman, Larry. 2023. “Unpredictable Times in Commercial Real Estate: Advice for Industry Leaders.” Forbes (April 27, 2023). https://www.forbes.com/sites/forbesbusinesscouncil/2023/04/27/unpredictable-times-in-commercial-real-estate-advice-for-industry-leaders/?sh=4b8ce61c2cff. Goodkind, Nicole. 2023. “Commercial real estate is in trouble. Why you should be paying attention.” CNN (March 27, 2023). https://www.cnn.com/2023/03/27/investing/premarket-stocks-trading/index.html.
2Federal Reserve Bank of St. Louis. Release Tables: Mortgage Debt Outstanding, Millions of Dollars; End of Period. 2022. FRED. https://fred.stlouisfed.org/release/tables?eid=1192326&rid=52.
3Goldstein, Matthew, Julie Creswell, and Peter Eavis. 2023. “Stress Builds as Office Building Owners and Lenders Haggle Over Debt.” New York Times (April 27, 2023). https://www.nytimes.com/2023/04/27/business/economy/office-buildings-banks-economy.html.
4Scaggs, Alexandra. 2023. “Just How Bad is Office CRE, Anyway?” Financial Times (April 28, 2023). https://www.ft.com/content/43cc14cf-72dd-4137-8b31-f1ca0731432e.
5Doolittle, Tom, and Arthur Fliegelman. “U.S. Commercial Real Estate Has Proven Resilient, but Emerging Risks Could Generate Losses for Lenders.” Brief no. 22-02, Washington, DC: Office of Financial Research, July 2022. https://www.financialresearch.gov/briefs/2022/07/19/us-commercial-real-estate-has-proven-resilient/.
6Peck, Emily. 2023. “Office Space Available for Rent Hits New Record High.” Axios (April 11, 2023). https://www.axios.com/2023/04/11/office-space-available-rent-hits-new-record-high.
7CBRE. 2023. “U.S. Office Sublease Availability Nearly Doubles Since Pandemic.” CBRE (April 20, 2023). https://www.cbre.com/insights/briefs/us-office-sublease-availability-nearly-doubles-since-pandemic.
8Foster, Margarita. 2023. “10 US Markets Lead Historic Office Sublease Availability.” LoopNet (March 28, 2023). https://www.loopnet.com/learn/10-us-markets-lead-historic-office-sublease-availability/1509687851/.
9ContractsCounsel. Office Lease. 2023. ContractsCounsel. https://www.contractscounsel.com/t/us/office-lease#:~:text=Most%20office%20space%20leases%20stretch,as%20part%20of%20the%20terms.
10Kastle. 2022. “The Data Science Behind the Back to Work Barometer.” Kastle (October 27, 2022). https://www.kastle.com/the-data-science-behind-theback-to-work-barometer/.
11Kastle. “Kastle Back to Work Barometer.” 2023. Kastle. https://www.kastle.com/safety-wellness/getting-america-back-to-work/.
12McDade, Aaron. 2023. “Offices across the US are at least half full for the first time since before the pandemic, new data shows.” Business Insider (February 3, 2023). https://www.businessinsider.com/us-offices-half-full-first-time-since-pandemic-report-2023-2.
13Nareit. “Monthly Index Constituents.” 2023. https://www.reit.com/data-research/reit-indexes/monthly-index-constituents.
14Wigert, Ben, and Sangeeta Agrawal. 2022. “Returning to the Office: The Current, Preferred and Future State of Work.” Gallup (August 31, 2022). https://www.gallup.com/workplace/397751/returning-office-current-preferred-future-state-remote-work.aspx.
15Indeed Editorial Team. 2023. “16 Benefits of Work from Home for Employers.” Indeed (February 24, 2023). https://www.indeed.com/career-advice/career-development/benefits-of-work-from-home-for-employers.
16Bhattarai, Abha. 2019. “Malls Are Dying. The Thriving Ones Are Spending Millions to Reinvent Themselves.” Washington Post (November 22, 2019). https://www.washingtonpost.com/business/2019/11/22/malls-are-dying-only-these-ones-have-figured-out-secrets-success-internet-age/.
17Nareit. “Estimating the Size of the Commercial Real Estate Market in the U.S.” 2021. https://www.reit.com/data-research/research/nareit-research/estimating-size-commercial-real-estate-market-us-2021.
18Elliot, Jenn. 2022. “Is the Retail Reckoning for Regional Malls at an End?” Wealth Management (November 28, 2022). https://www.wealthmanagement.com/retail/retail-reckoning-regional-malls-end.