The OFR Introduces Interactive U.S. Money Market Fund Monitor
Published: July 20, 2016
The Office of Financial Research today released its Money Market Fund Monitor, a set of interactive charts for exploring the portfolios of U.S. money market funds.
Money market funds have been popular for decades among investors who want better returns than bank accounts offer, but still with little risk. Since the 1990s, institutional investors have used money market funds as a professional cash management option.
The funds strive to maintain the value of the money invested in them. In 2008, at the height of the financial crisis, investors in an established fund lost money when the price of each share fell slightly below $1 — called “breaking the buck.” In the ensuing weeks, investors pulled hundreds of billions of dollars out of prime money market funds in favor of safer investments, such as government money market funds. The government stepped in to insure funds temporarily. That support ended in 2009. (As of October 2016, regulations will require prime funds for institutional investors to use floating share values rather than a fixed share price.)
A lack of detailed data about fund holdings blocked regulators from seeing risks quickly in 2008. Since then, regulators have begun to require funds to report detailed data about their holdings more frequently. Funds are also required to hold more liquid assets.
To develop the new Money Market Fund Monitor, the OFR analyzed more than 4 million records of monthly data on the holdings of about 500 funds over five years. Before now, the data were on the Securities and Exchange Commission website as separate individual filings and industry-level monthly reports. The OFR monitor displays the data in a graphical format that is easy to adjust to the needs of any user. Any user can download the data into spreadsheets.
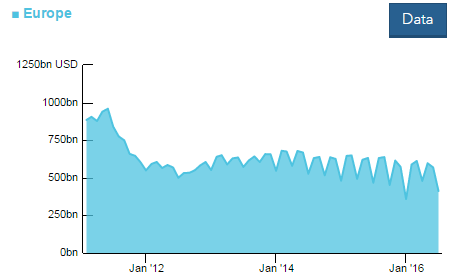
The monitor has various uses, such as tracking industry trends. For example, the figure below, taken from the monitor, shows that prime money market funds’ investments in European bank issuers have dropped at the end of each quarter from 2013 to the present. This pattern suggests that banks reduce their funding from money market funds to improve their balance sheet profiles when they submit quarterly financial data to regulators. A 2015 OFR working paper discussed this phenomenon using different data.
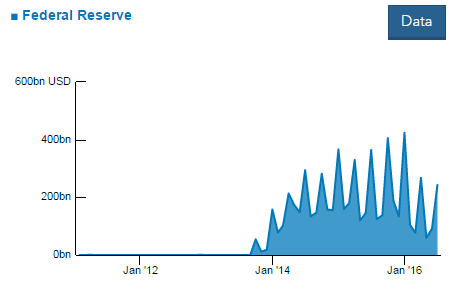
Because of those funding decisions by banks, money market fund managers may have fewer ways to deploy cash at the end of each quarter. The chart below, taken from the monitor, shows a quarter-end surge in money market funds turning to the Federal Reserve’s Reverse Repurchase Agreement Facility as an investment option.
An OFR brief published today provides more detail about each chart in the Money Market Fund Monitor. The monitor will be updated monthly as funds file new data.
The Money Market Fund Monitor is the latest product of the OFR’s monitors program. The OFR already produces the quarterly Financial Markets Monitor and the biannual Financial Stability Monitor.
Stacey Schreft is Deputy Director for Research and Analysis at the Office of Financial Research