Lenders Value Borrower Relationships
Published: March 6, 2024
The Value Lenders Place on Their Borrowers is Likely 11.6% of the Loan’s Principal
When a borrower violates their loan terms, the lender has a choice. The lender can enforce the terms of the contract and risk their relationship with the borrower, or the lender can forbear and lose out on the financial benefits of enforcement. In a new working paper, “The Value of Lending Relationships,” the authors develop a model that quantifies this trade-off. The authors find that the actions lenders take imply that the value lenders place on their relationships with corporate borrowers is equivalent to an average of 11.6% of the loan’s principal. Understanding what factors make lenders value one borrower relationship more than another is important to understanding forbearance during periods of financial instability.
Borrowers are about 30% more likely to end their relationship with a lender following a covenant enforcement. This outcome is quite costly to an incumbent lender, as relationship value depends on the ability to use the relationship to generate future business. For example, relationship lending may benefit banks through retaining credible borrowers and tying related services to primary lending. Lenders value relationships more when there is more potential for cross-selling. In such cases, the lender has more opportunity to generate future income from the relationship.
The working paper’s authors aggregated relationship value to the lender level, finding that relationship value significantly varies across banks and is similar in magnitude to traditional equity capital. However, there are several factors that increase or decrease this value. Lenders place more value on relationships with borrowers that are more dependent on loan financing and have worse credit ratings. The lender’s revealed value for a borrower relationship is higher when the lender’s informational advantage over competing lenders is greater. Lenders also place greater value on relationships with borrowers that have fewer outside options. For example, the value is higher when there is otherwise less lending activity in that borrower’s local region and within its industry, suggesting a less-competitive local banking market and so more restricted alternatives for the borrower.
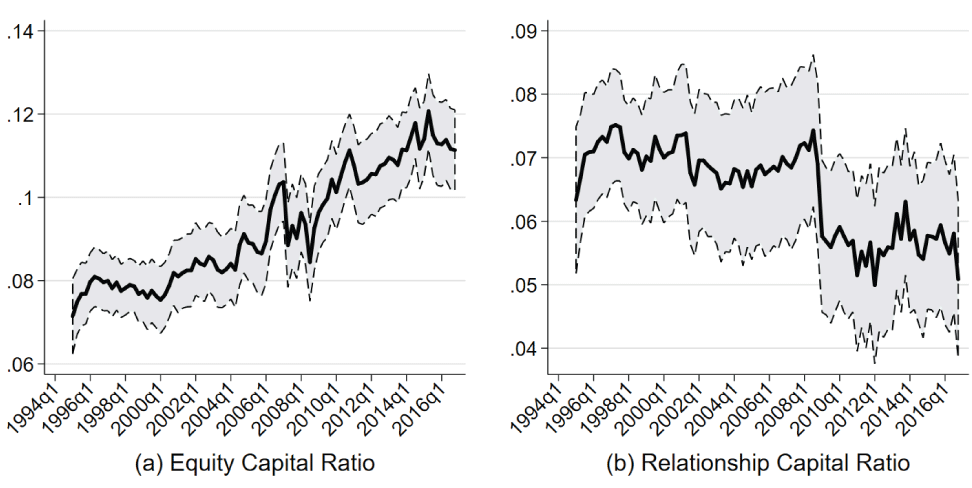
Understanding these relationships is important to understanding forbearance during periods of financial instability. In a downturn, lenders may be forced to make a trade-off between lending to borrowers they value more and lending to borrowers they value less. For example, relationship capital fell during the Great Financial Crisis, as shown in the following figure. Unlike equity capital, which similarly fell during this period, relationship capital has yet to recover to its precrisis levels. This indicates both a substantial loss in relationship value and a different portfolio of implicit obligations among banks.
Figure 1. Bank Capital Over Time

Note: This figure presents the mean and 95% confidence interval for two different capital ratios during our sample period. Subfigure (a) presents the time series pattern of the ratio of equity capital to total assets, and subfigure (b) presents the time series pattern of the ratio of relationship capital to total assets.
Sources: Center for Research in Security Prices, FRED Economic Data, Refinitiv, S&P Global, Wharton Research Data Services, Authors’ Calculations